For many years now, I have been using Cacti as the old school network monitoring system. This is a classical network monitoring system which you install, configure and forget as I runs without much maintenance.
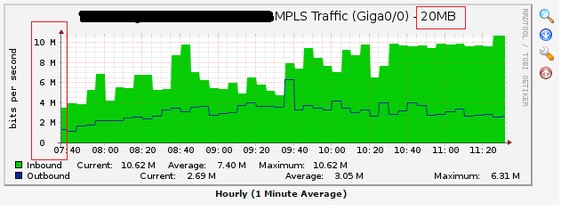
Then someone asked me the network utilization graph for one of the MPLS links (20Mbps) which is currently peaking at 10Mb. In this graph, we have the Y-axis (left side) set at 10M max at this moment. I was asked if I can fixed the axis at 20Mb to give indication to the viewer that we still have enough traffic capacity for this MPLS link
Then someone asked me the network utilization graph for one of the MPLS links (20Mbps) which is currently peaking at 10Mb. In this graph, we have the Y-axis (left side) set at 10M max at this moment. I was asked if I can fixed the axis at 20Mb to give indication to the viewer that we still have enough traffic capacity for this MPLS link
Then I starting re-reviewing Cacti documentation which points to the auto-scaling in the graph template.
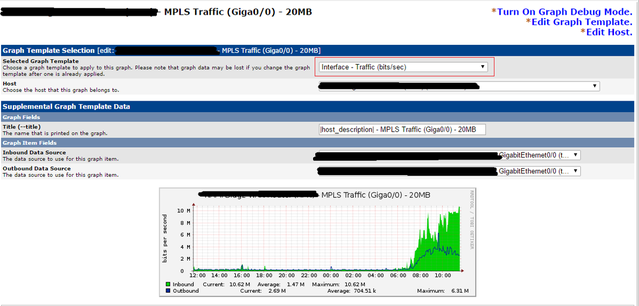
Below are quick configuration steps in how to fixed the Y-axis for specific graphs. First, you have to determine the graph template used for this graph you want to modify. For the 20Mb MPLS graph above, the graph template "Interface - Traffic (bits/sec)" was used as seen below.
Below are quick configuration steps in how to fixed the Y-axis for specific graphs. First, you have to determine the graph template used for this graph you want to modify. For the 20Mb MPLS graph above, the graph template "Interface - Traffic (bits/sec)" was used as seen below.
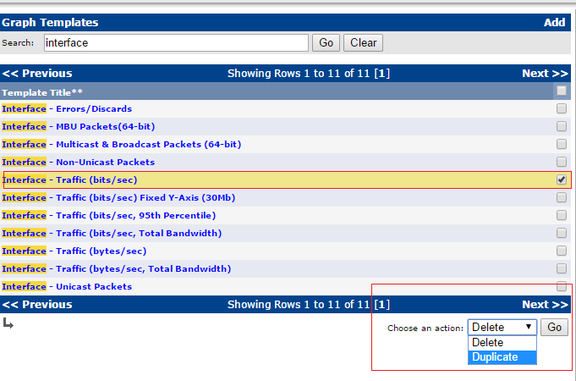
In the "Graph Templates" section, we locate this template and then duplicate it because modifying this existing template will affect all other graphs using this template.
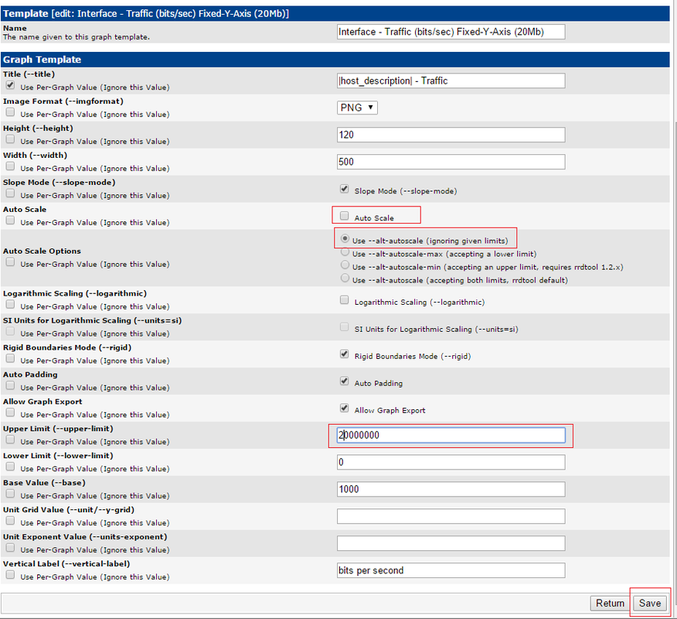
Once the new graph template is created, we then need to configure this. Below are the recommended setting which works for me on setting the Y-Axis fixed for 20Mbps. Kindly note that 20000000 in the "upper-limit" field is equal to 20Mb.
After saving this template, we need to apply this template to the graph in focus.
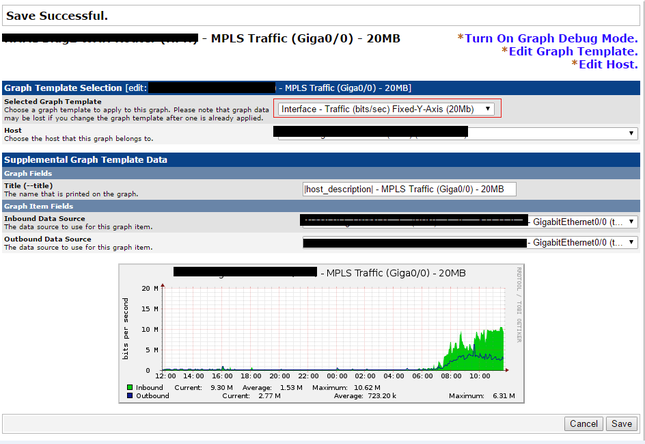
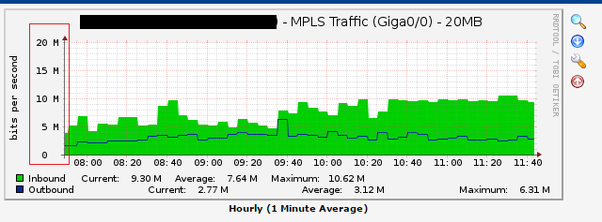
After applying the new graph template to graph, we would see the network utilization graph for this MPLS set at max 20Mb on the Y-Axis.
I hope this helps old school Cacti lovers.
 RSS Feed
